US House of Representatives: The Arithmetic of the Wyoming Rule
Tagged:CorporateLifeAndItsDiscontents
/
MathInTheNews
/
Politics
/
SomebodyAskedMe
Over dinner a few days ago, we were talking about about whether the Wyoming Rule would fix some of the bias in the Electoral College. The ‘Wyoming Rule’ is a proposal to make the US House of Representatives more representative of people, not territory. How might the arithmetic work out for which party gets more seats?
Some Anti-Democracy Aspects of US Government
There are a depressing number of ways in which the American government, at the federal
level, is not only undemocratic (not representing the populace fairly) but actually
anti-democratic (deliberately designed to be so):

-
The most famous, and recently most aggravating, is the Electoral College. This is the 18th century Rube Goldberg machine designed (a) to avoid the then-controversial idea of direct democracy and (b) to appease the southern slave states by over-representing their votes. Basically the election selects 535 politically elite people, like a copy of Congress, who were supposed to decide the election. In practice, they are legally ‘bound’ to vote for their party.
This over-represents red states, and introduces numerous opportunities to elect a candidate who loses the popular vote.
-
The US Senate specifies 2 senators per state, regardless of population. Thus, to pick the least and most populous states, a Wyoming senator represents only 576,851/2 = 288,425 people, whereas a California senator represents 39,538,223/2 = 19,769,111 people.
Residents of Wyoming, and other rural (now red) states are wildly over-represented and can thus impose a veto on policies preferred by the majority.
-
Finally, the US House of Representatives also over-represents the red states. It was initially supposed to have at least 1 representative from each state, but after that proportional to population. (This was, as you might expect, gamed relentlessly by politicians, with various methods, choices of divisors, and the infamous 3/5 humanity of enslaved people.)
However, with the House currently capped at 435 seats (q.v.), the allocation algorithm (below) again over-represents rural red states.
 About the Electoral College, there are only paths to a more democracy-centered system.
Either:
-
A constitutional amendment to replace it (with either a popular vote yet, a ranked choice vote).
Republicans would, of course, block this hysterically, as it would remove their over-representation in power.
-
The National Popular Vote Interstate Compact.
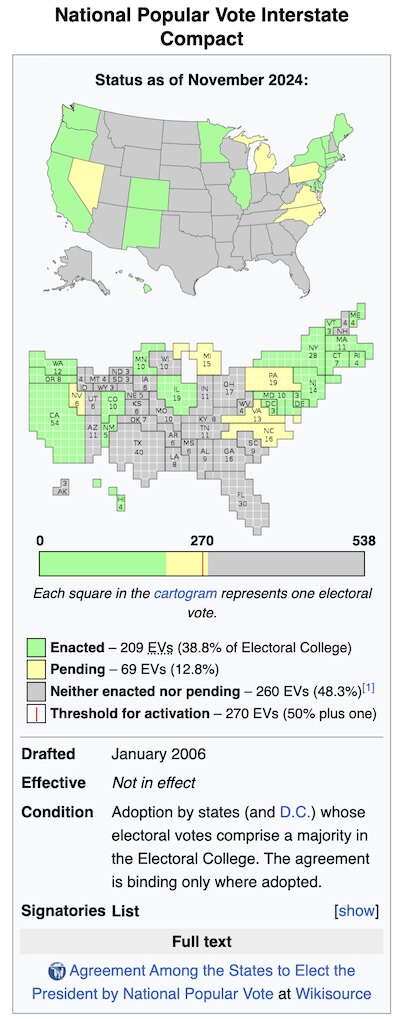
This is a counter-Rube-Goldberg-Machine in which a block of states say they will allocate their Electoral College votes to the winner of the national popular vote, no matter what their individual state vote is. It only goes into effect when enough states pass it to control 270 electoral votes, enough to decide the election.
The current (2024-Nov-22) status, shown here from Wikipedia, has states holding 209 electoral votes having passed it. So… not quite enough yet. But it’s pending in states representing another 69 electoral votes; if it were to pass in all those states then it would go into effect.
Of course, in that eventuality, Republicans would again hysterically claim in court that this is unconstitutional. With the extremely right-wing packed Supreme Court, they may be able to kill it and thus perpetuate their over-representation.
About the Senate, there is, I believe, little that can be done. It’s wired into the constitution that they represent states instead of people, so they will always over-represent the rural red states. (We could, of course, abolish states and replace them with federal administrative districts chosen by a Voronoi tessellation based on population. While this is my favorite, it is a hopeless cause.)
But the House! There, we can do something constructive if we ever regain majorities in Congress and the presidency so as to be able to pass legislation. We could return to a system of allocating House seats based on population without too much trouble.
This is the basis of the ‘Wyoming Rule’, whose arithmetic we’ll study today.
How Seats in the House are Allocated Now
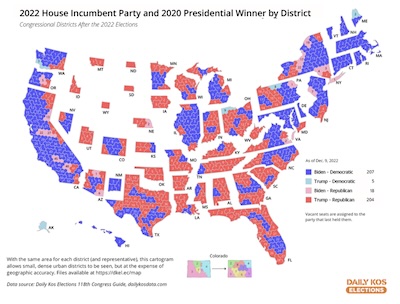
Here’s a map from Daily KOS [1] showing the House districts in 2022, colored by party of the representative and how their district went for president.
The size indicates the population of the district. The usual depiction shows the districts at their normal geographic size, giving the impression that the US is a vastly conservative, red nation. However, most of those red districts have very few people in them! This representation, more faithful to population than real estate, gives a different picture of a nation divided largely along coastal/interior, urban/rural, and educational lines.
Question: If we’re so equally divided, why is it so hard for Democrats to obtain power and so easy for Republicans to either be in control or enough to block everything when Democrats are in control?
The answer, of course, is a complex combination of factors involving as above the Electoral College and the Senate.
But in the case of the House, the culprit here is the Permanent Reapportionment Act of 1929. [2] This respects the constitutional requirement of at least 1 representative per state, but caps the total size of the House at 435. Now, think that over for a second: you cannot do both of those things and simultaneously allocate representatives in proportion to population! The net effect is to cap the representation of the large population, mostly urban states in favor of the rural red states again.
The mathematical details are a bit interesting, employing something called the Huntington-Hill method: [3]
- First allocate 1 representative to each state, which then leaves 385 seats to assign.
-
Calculate the population per seat for each state so far, and call that the “allocation number” As. If Ps is state s’s population, then with ns seats this could be either As=Ps/ns or As=Ps/(ns+1), depending on whether we count the next seat to be added (and it matters which you do). In what appears to be mathematical nonsense but an acceptable political compromise of the geometric mean. (This is reminiscent of a continuity correction, but I don’t quite see the connection.)
As=Ps√ns(ns+1) - Allocate the next seat to the state s with the largest As, i.e., the most people for the seats they currently have.
- Repeat, starting again at step 2, until all seats are assigned.
Given that you’re gonna cap the House, this is as good a method as any. But… it’s a weird way to enforce the magical 435 seat cap!
The ‘Wyoming Rule’
A frequently proposed alternative is the Wyoming Rule. [4] Briefly, it proposes to scrap the Permanent Apportionment Act of 1929, and replace it by:
- The state with the smallest population, currently Wyoming, gets 1 seat.
-
Each other state s gets a number of seats of about Ps/PWyoming.
(The “about” is because people can’t resist fussing with floor, ceiling, and round to get an integer number of representatives. I used rounding, below.)
This would expand the House, and my intuition says it would preferentially expand in favor of the blue states to undo the current red state bias. Let’s see what the arithmetic (we can hardly call it “math”!) says.
What Would That Look Like?
Let’s get some data:
- We’ll start from data on population of US states and territories [5], then remove the territories, DC, and other sources of non-voting members in the House.
- Then we’ll add in the partisanship of each state’s House delegation, using the 2022 House as the most recent complete data. [6]
We assembled those data into spreadsheets and wrote an R script to get some statistics on how many new delegates there would be, and their likely partisanship. [7]
Being good little scientists, let’s first summarize what we expect the result to be, and then compare with reality:
- I thought the size of the House would explode, to 600-700 seats.
- I thought the seats would be overwhelmingly in favor of the blue states, conferring a majority to Democrats.
The results are sorta like that, but more equivocal:
- The size of the House does go up, but only to 574. (This agrees with the calculation in the Wikipedia page on the Wyoming Rule, so we’re generally making sense and not lost in the mathematical weeds.)
- Then we compute the mean and standard deviation of the number of new states allocated to
each state. It’s (to me) surprisingly close, with some bias to blue states, but not
overwhelming:
Partisanship Change.Total Change.Mean Change.StdDev 1 Blue 73 3.04 3.75 2 Red 67 2.58 2.91 - Doing a t-test with unequal variances to test the difference in means for statistical
significance, we conclude that due to the large standard deviations, it’s not
significant:
Welch Two Sample t-test data: House.Seats.Change by Partisanship t = 0.48671, df = 43.406, p-value = 0.6289 alternative hypothesis: true difference in means between group Blue and group Red is not equal to 0 95 percent confidence interval: -1.460393 2.389880 sample estimates: mean in group Blue mean in group Red 3.041667 2.576923 -
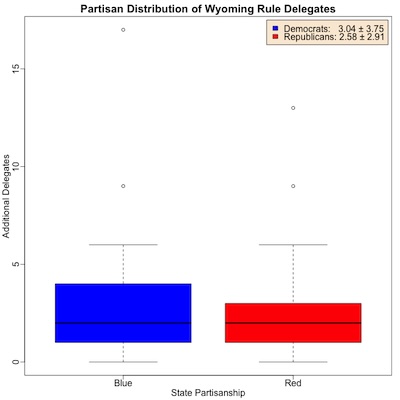
A boxplot of the distributions of number of new seats per state, stratified by party, is shown here.
It confirms visually that we have a slight Democratic advantage, but not by any means overwhelming. There’s a slight advantage to Democrats both in the mean number of seats/state gained and in the upper outliers.
But really, we don’t need statistical significance or an overwhelming majority, we just need a majority that reflects the (barely) blue majority in the country and doesn’t advantage conservative rural districts. Do we have that?
Well, it depends. Just because a state gets some new states doesn’t mean we know how those seats will be allocated. Let’s consider 2 cases:
- Suppose politicians are unable to resist gerrymandering – which seems like the
safest of safe bets – and they allocate all the new seats to the majority party
in their delegation. Then we end up allocating only 6 more seats to Democrats:
Republican Democratic 67 73 - If, on the other hand, we allocate seats in each state in proportion to the
Republican/Democratic seats in that state, we get about a 10 seat advantage to
Republicans:
Republican Democratic
        75         65
Personally, I think dangling the catnip of more seats in front of the parties will drive them to gerrymander like mad. But I’m a grumpy old retired scientist, so I would say that, wouldn’t I?
The Weekend Conclusion
I was gonna call this post Die Grundlagen der Arithmetik von Wyoming, but I had a sudden and rare attack of common sense (about Frege jokes, at least).
Yes, the Wyoming Rule would allocate more House seats, mostly to blue states.
But… it’s a bit ambiguous how those seats would be filled, given the inability of our politicians to resist gerrymandering. It was strange to find out things could go either way!
(Ceterum censeo, Trump incarcerandam esse.)
Notes & References
NB: Many of these sources are from Wikipedia, which I admit is not exactly high scholarship. On the other hand, I’m only trying to establish basic facts like population and partisanship of House seats, for which Wikipedia is perfectly fine as a source. So please be a little tolerant, ok?
1: S Wolf, “Daily Kos Elections presents our guide to members of the 118th Congress and their districts”, Daily KOS, 2022-Dec-12. ↩
2: Wikipedia Editors, “Reapportionment Act of 1929”, Wikipedia, downloaded 2024-Nov-22. ↩
3: Wikipedia Editors, “Huntington-Hill Method”, Wikipedia, downloaded 2024-Nov-22. ↩
4: Wikipedia Editors, “Wyoming Rule”, downloaded 2024-Nov-22. ↩
5: Wikipedia Editors, “List of U.S. states and territories by population”, Wikipedia, downloaded 2024-Nov-22. ↩
6: Wikipedia Editors, “2022 United States House of Representatives elections”, Wikipedia, downloaded 2024-Nov-22. ↩
7: WeekendEditor, “R script to analyze the Wyoming Rule data”, Some Weekend Reading blog, 2024-Nov-22.
- There is also a text transcript of running this, so you can check that it says what I say it said.
- The data on district populations, percent of nation, percent of Electoral College, and so on is available both as a tab-separated text file and as a binary spreadsheet in Apple .numbers format.
- The data on district partisanship is also available as a tab-separated text file.
- The most useful data to consult, however, is the omnibus dataset which combines both of those, by doing an inner join operation on the state name. It is also available as a tab-separated text file. ↩


Gestae Commentaria
Comments for this post are closed pending repair of the comment system, but the Email/Twitter/Mastodon icons at page-top always work.