Are Stock Market Streaks Meaningful?
Tagged:Investing
/
MathInTheNews
/
R
/
Statistics
Does it mean anything when the stock market goes up several days in a row? Or down?
The Question
I happened across this video [1] by Azul Wells, who appears to be a retirement-oriented financial planner. He seemed reasonably calm and didn’t say lots of obviously wrong stuff, so I listened for a few minutes.
He notes that the generally useless CNN Business reported that:
- The Dow fell more than 1100 points.
- This was an 11 day losing streak, which hasn’t happened for 50 years.
- The previous time was 1974-Sep-20 through 1974-Oct-04. Recall that 73-74 was a brutal bear market. (I was a university freshman, dazzled by the study of physics, and hence blissfully unaware, but too poor to invest anyway.)
- On the other hand, the year-to-date numbers (almost the whole of 2024) indicate the Dow is up 13%, and the S&P500 is up a bit over 24%.
He goes on to talk about valuations. He includes:
- The Shiller CAPE10, which averages P/E ratios over business cycles with inflation adjustments (though originally found in Graham & Dodd’s 1934 book, Security Analysis [2], but this measure was popularized in modern times by Shiller).
- He also mentions Buffet’s stock market value-to-GDP ratio [3] [4], which is a similar thing but for the economy as a whole.
Yes, stocks are overvalued, according to these longer-term indicators.
But does a very short-term 11-day run of declines mean anything noteworthy, or is it just noise?
The Answer
You know how we roll, here on this Crummy Little Blog That Nobody Reads (CLBTNR): we don’t take someone’s opinion for truth, not even our own. We always appeal to data, and let it tell us what the truth really is.
Prediction: We will find this is of no significance.
A Model
We’ll model each day’s stock market result as an independent identically distributed draw from a Bernoulli distribution (a coin flip, but slightly biased in favor of “up” days, to get stocks going mostly up over time):
{Pr(market goes up today)=pPr(market goes down today)=1−pfor some parameter p which is slightly bigger than 50%.
We’ll use data to estimate the model (get a value and confidence limits on p), then look at actual stock market data to see how frequent runs are, and compare. We’ve written a little R script to do this [5].
Estimating the Model With Daily Stock Market Data
Azul spoke of the Dow Jones Industrial Average, but that’s pretty much a trash index. It’s only 30 industrial stocks, and they’re price-weighted instead of capitalization-weighted to ease hand computation back in the day. So if a stock has a split, the index changes, even though nothing economically meaningful has happened! The only reason for the Dow is that the media keep shouting it into your ears.
He also mentioned, but did not analyze for streaks, the S&P500. Now, this is better: it covers about 70% of the US stock market by capturing the large companies, and it’s properly capitalization-weighted. But… it leaves out all the small-cap companies, which are sometimes the most interesting ones!
So we’ll use the US Total Stock Market Index, which includes pretty much everything, properly capitalization-weighted. It used to be the Wilshire 5000 index, but then went through several acquisitions. It’s now owned by Standard & Poors.
Vanguard even has a mutual fund (VTSAX) and an ETF share class (VTI) which tracks it quite accurately, so lots of data is easily available and in a form that could be an actual investment accessible to ordinary folks.
We obtained the price (and distribution series) for VTI from Yahoo Finance [6]:
- This got us 5922 trading days of data, from 2001-Jun-18 - 2024-Dec-30.
- Since we have to compute the difference with respect to the previous day, we can’t tell if the market went up or down on the first day. So we have 5921 trading days where we know if VTI went up or down, or just a hair over 23 years of data.
- In all cases, we used the “Adjusted Close” column, which is supposed to be corrected for things like splits and so on.
We found the market went up 3,226 days and down 2,695 days in that time interval. A naïve estimate of the probability the market goes up on a single day would then be:
p=32263226+2695=54.48% We can do a bit better with Bayesian methods to estimate the probability distribution
reflecting our knowledge of p:
- Start with a uniform prior, i.e., Pr(p) is a uniform distribution on [0,1]. This is, in fact the Beta distribution B1,1.
-
After observing 3226 up days out of a total of 5921 days, our posterior estimate will still be a Beta distribution, but with much larger parameters reflecting our experience of a much larger number of trading days:
Pr(p|N=5921,k=3226)=B3226+1,5921−3226+1(p)=B3227,2696(p)
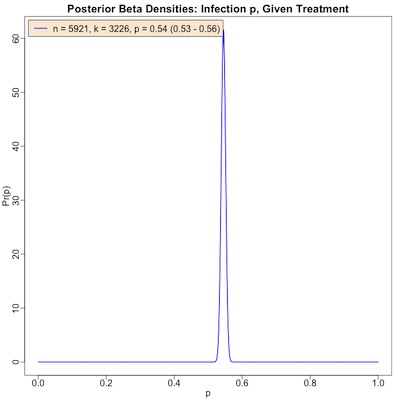
That’s the distribution shown here. Its median value is 54.48%, in strong agreement with the naïve estimate above.
But now we can get 95% confidence limits (or, as Bayesians would say, a 95% credibility interval). That has as its lower estimate the place where only 2.5% of the distribution is lower, and as its high point the place where only 97.5% of the distribution is higher. After all that, we can be 95% certain that the true value is somewhere in that interval, i.e., we can report how certain we are after observing 5,921 trading days.
The result is:
p=54.48% (95% CL: 53.21%−55.75%)So we’re quite confident in our estimate that the market goes up about 54.48% of the time, on any single day. It would be very difficult to argue us out of believing that the true answer is somewhere in 53.21% - 55.75%.
What Do We Observe About Runs?
Armed with this dataset, we can also see empirically how often there are runs of up days
or down days. This is exactly the job of the run-length encoding function
rle() in R;
quoting from the transcript file, we made frequency tables that tell us how often we
observed up/down streaks of a given number of days:
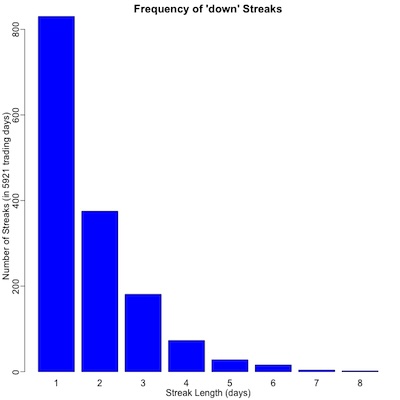
  - For down streaks (plot to ./2025-01-01-stock-market-streaks-barplots-down.png):
  1   2   3   4   5   6   7   8
830 375 181  73  28  16   4   2

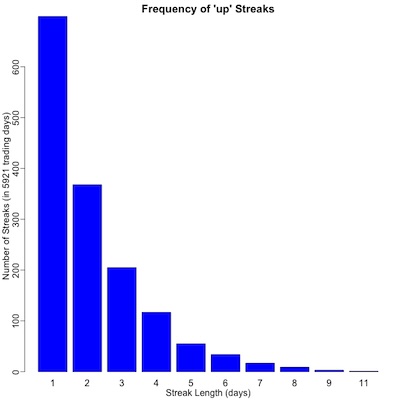
  - For up streaks (plot to ./2025-01-01-stock-market-streaks-barplots-up.png):
  1   2   3   4   5   6   7   8   9  11
699 368 205 117  55  34  17   9   3   1

 The top row there reports the length of a run (in days), and the bottom row the number of
times a run of that exact length was seen in the data.
This is shown graphically in the 2 plots here. We note that:
- For both “up” and “down” days, frequency declines sharply with length of the run. That is, long runs are increasingly less probable.
- For streaks of “up” days the max was 11 days, but only 8 for “down” days.
- On the one hand, we expect this since the probability of going up is higher!
- On the other hand, Azul asserted there was an 11-day down streak. But he’s looking at the Dow Jones, and we’re looking at the total US stock market. There are bound to be differences, and ours reflects investable US equities better.
Azul looked back about 50 years, to 1974. We looked back about half as far, to 2001. But even with our shorter dataset, we see that long(ish) streaks are a thing that happens often enough that you should expect to see them a time or two.
Is That Reasonable?
We’d like to ask: if daily changes in the stock market are random walks with the p-Bernoulli distribution above, how often should we expect to see a streak of a given length or longer?
This turns out to be surprisingly difficult, with a variety of solutions proposed! [7] [8] [9] [10]
For example, two references give the probability of seeing a streak of length ≥m in n trials with individual success probability p as:
Pr(≥m|n,p)=⌊nm⌋∑k=1[(−1)k+1(p+(n−km+1)(1−p)k)(n−kmk−1)pkm(1−p)k−1]They assert that this was first derived by de Moivre in 1738, using the method of generating functions. Now, generating functions are lovely beasts, and I’ve even had occasion to use them in anger once or twice. But deriving this is more than I care to do at the moment. (Also, others dispute the exact limits on the sum, the contents of the combinatoric symbol, and so on. I don’t propose to chase down all those loose ends!)
So we have a formula of questionable provenance whose truth we haven’t ourselves proven, about which there is some amount of dispute (though 2 different sources give it), and which is pretty complex.
Yeah, sure, let’s try it!
The result is that for:
- 5921 trading days we observed,
- with a per-day probability of decline of 45.52%,
- at least 1 run of 8 or more down days (we saw this twice in the VTI data)
- has overwhelming probability 99.75%!
Caveats:
- We haven’t verified the above formula, and there is some disagreement about it.
- The straightforward implementation of that formula just slaps you in the face and hands
you a NaN, which is not too useful!
- Investigation shows that the combinatoric choose symbol is overflowing to infinity, basically because 5,921 trials is absurdly large.
- So we took the last 3 factors (the choose and the 2 powers of p’s) into log
space, summed up the logs, and re-exponentiated. The small p factors compensated
and the result was always finite.
(-1)^(j+1) * (p + ((n-j*m+1)/j)*(1-p)) * exp(lchoose(n-j*m, j-1) + (j*m)*log(p) + (j-1)*log(1-p))
- However, this is a terrible way to proceed numerically, since the terms in the sum are alternating in sign and become quite large before settling down. The chance that this is numerically stable is extremely low!
However, unless we want to follow de Moivre down the generating function rabbit hole to verify the formula and then numerically stabilize it, this is where we’ll have to stop!
We’ve concluded empirically that long(ish) runs happen, because we see them in the data. The analytical solution for the probability seems quite intricate and probably of doubtful numerical stability, but it agrees that long(ish) runs are likely.
The Weekend Conclusion
No. It likely does not matter. Buy, hold, and rebalance.
Fortunately, that seems to be Azul’s conclusion. The 11-day thing was just a stalking horse to get people’s attention focused on their duty not to react to daily market moves.
(Ceterum censeo, Trump incarcerandam esse.)
Notes & References
1: A Wells, “Did The Stock Market Just Flip?!”, YouTube, 2024-Dec-30. ↩
2: B Graham & D Dodd, “Security Analysis”, Whittlesey House/McGraw Hill, 1934. ISBN: 0-07-144820-9 (2005 edition). ↩
3: Wikipedia Editors, “Buffett indicator”, Wikipedia, downloaded 2025-Jan-01. ↩
4: W Buffett & C Loomis, “Warren Buffett On The Stock Market”, Fortune, 2001-Dec-10.
NB: The original is no longer on the Fortune web site where Wikipedia links; this is an archival copy we got some years ago, stashed here on this Crummy Little Blog That Nobody Reads. ↩
5: Weekend Editor, “R script to analyze daily runs in the stock market”, Some Weekend Reading blog, 2025-Jan-01.
NB: There is also available a transcript of running this, in case you want to peer review me. ↩
6: Yahoo Finance Staff, “VTI Historical Data”, Yahoo Finance, downloaded 2024-Dec-30.
NB: We separated this data into 2 tab-separated data files: one for the share price time series, and the other for the distributions (dividends/capital gains/splits time series).↩
7: Ask &c Staff, “Q: What’s the chance of getting a run of K or more successes (heads) in a row in N Bernoulli trials (coin flips)? Why use approximations when the exact answer is known?”, Ask a Mathematician/Ask A Physicist, 2010-Jul-24. ↩
8: Z Mukherjee, “Answer to: If I flip a biased coin 𝑛 times, what is the probability that I get a streak of ≥𝑚 heads in a row at some point? [duplicate]”, Math StackExchange, 2017-Oct-20. ↩
9: ‘user940’ (Byron Schmuland), “Answer to: Probability for the length of the longest run in n Bernoulli trials”, Math StackExchange, 2014-Mar-11. ↩
10: MF Schilling, “The Longest Run of Heads”, College Mathematics Journal 21:3, 1990-May, pp. 196-207. DOI: 10.2307/2686886. (An open-access version has been archived here at Cal State Northridge, Schilling’s institution.) ↩

Gestae Commentaria
Comments for this post are closed pending repair of the comment system, but the Email/Twitter/Mastodon icons at page-top always work.